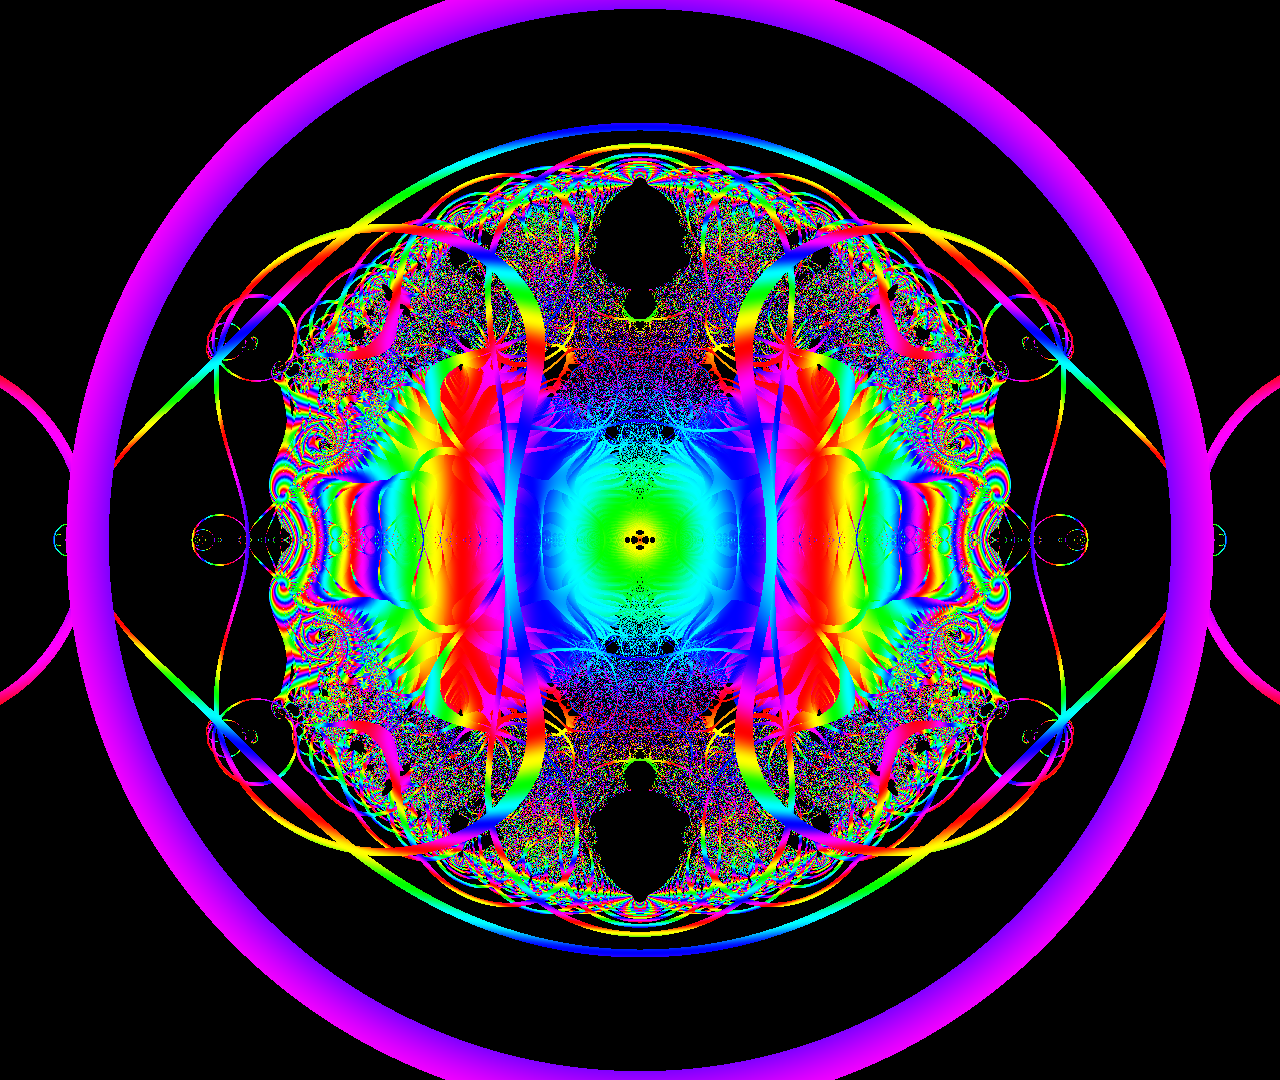
Fractals are visualized in the complex plane using a simple complex dynamical system equation that generates fractal chaos. This is the second version with the same formula from the previous version, but with a different graphing algorithm.
You can actually change the values, etc., yourself using the slider in the upper right corner, so please experience the various changes of chaos fractals.
How to use:
<Operation on the screen>
Pan: Move the screen while holding down the mouse button in the graphics display area.
Zoom: Scroll in the graphics display area to zoom.
<Upper left slider>
Light blue display: Indicates FPS (processing speed). 60fps is displayed if the camera runs normally.
Green display: Also indicates processing speed. This is not used.
You can switch between the two by clicking on it.
<Upper right slider>
Each parameter inside the CG simulation can be changed using the slider.
ini_r: the size of the initial value \( x(0),y(0) \) can be changed.
ini_theta_speed: allows you to change the speed at which the picture changes (rotates) (the increasing speed of \(\theta_{initial}\) in the initial value \( x(0),y(0) \)).
colorMagnification: allows you to change the appearance of the colored gradient.
threshold: allows you to change the range (line thickness) within which the coloring is applied.
Simulation Description:
This graphic is drawn from one simple equation and an algorithm that applies the properties of that equation.
We use the equation of the dynamical system,
\[ x(n+1)=r \left(cos \theta +i sin \theta \right) \left(x(n)-\frac{1}{x(n)}\right) \\[1.5cm]
n \in \mathbb{N},x(n),y(n)\in \mathbb{C},\epsilon_{x,y} \in \mathbb{R}\]
,which generates chaotic waveforms.
The initial value should be set as shown below. ( ini_r\( \equiv r_{initial} \) )
\[ x(0)= r_{initial}\left(cos \theta_{initial} +i sin \theta_{initial} \right) \]
Repeating the calculation of this equation yields numerical data along a time series, and changing the initial values will show various results.
This time, the polar coordinates \((r,\theta)\) are assigned to the complex quadratic plane, and each pixel is colored according to the convergence value of \(x(n)\), which is one of the results of repeated calculations.
Author: Shohto Higa


0 thoughts on “2D simulation of chaos fractal Ver.2”